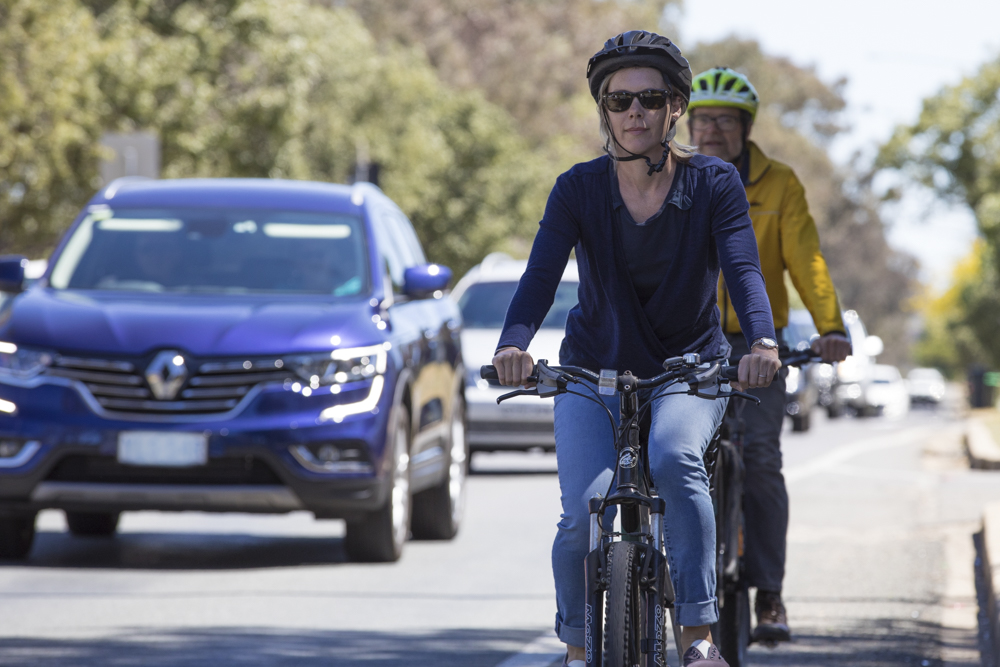
Braddon, Reid and the city are ‘becoming exclusive’, according to the AUO data. Photo: Michelle Kroll.
Data released by the Australian Urban Observatory has revealed that almost 90 per cent of Canberra’s suburbs are gentrified and at risk of becoming exclusive.
The AUO’s Precarity Index for Neighbourhoods and City Housing (PINCH) uses ABS census data from 2016-21 to assess the changing proportions of income groups and housing affordability and determine areas where lower and mixed-income households have been priced out by higher-income households or are at risk of being priced out.
“Rapid increases in housing costs over time are associated with ongoing gentrification while displacement results in fewer low or mixed-income households remaining in an area over time due to increasing housing affordability,” the AUO says.
Suburbs are divided into eight categories based on the level of gentrification, with one the lowest and eight the highest. The majority of Canberra is ranked at number six, ‘at risk of becoming exclusive’, with mostly higher-income households and rising housing costs.
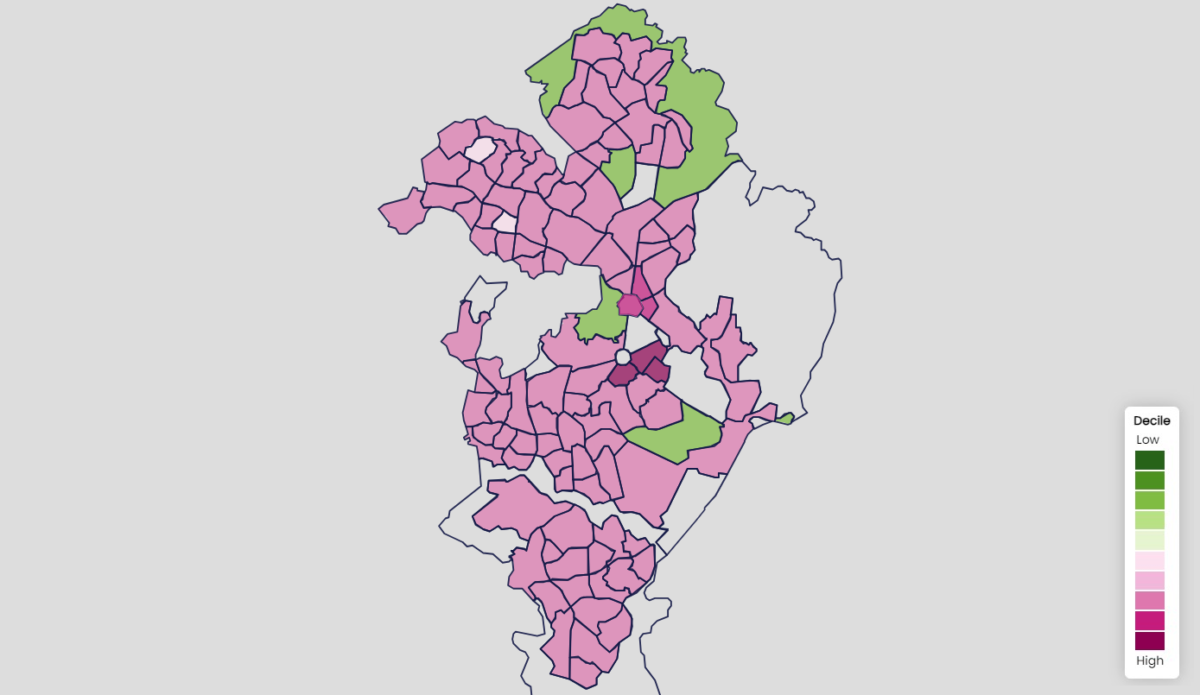
According to the PINCH, most of Canberra’s suburbs are ‘at risk of becoming exclusive’. Image: Australian Urban Observatory.
AUO director Associate Professor Melanie Davern, who sits within the Centre for Urban Research at RMIT University, told Region the data suggests “it’s probably been quite stably gentrified in Canberra for a long period of time now”.
“This is based on three major types of information,” she said: population groups according to income, housing costs and housing types, and an understanding of who the region is affordable to.
“You can see the majority of areas in Canberra at risk of becoming exclusive … So we know that going back to the definition, at risk of becoming exclusive [means] areas with mixed or high incomes … with marginal or rapid increases in housing costs.”
Three areas – the city, Braddon and Reid – fell into the category of ‘becoming exclusive’, meaning that the median income has increased over the past five years, alongside rapid increases in housing costs and an absolute loss of low-income households.
Four suburbs – Gunghalin, Acton, Symonston and Oaks Estate – were classified as ‘low-income/susceptible to displacement’, with 55 per cent of the population low-income or mixed-income households as of 2021.
Kingston, Barton and Forrest were classed as areas that remained ‘exclusive’ to high-income households between 2016 and 2021.
The data can partly be explained by the fact that Canberra is a city with a generally higher socio-economic advantage and a larger number of people in higher-income positions. However, looking at the AUO’s other indicators, such as the distribution of the capital’s population employed as managers or professionals, there appears to be a difference between the inner and outer suburbs that is not reflected by the PINCH.
The AUO’s liveability index (below) particularly highlights that, while most suburbs of Canberra are becoming more expensive to live in, the standard of living across the capital region varies.
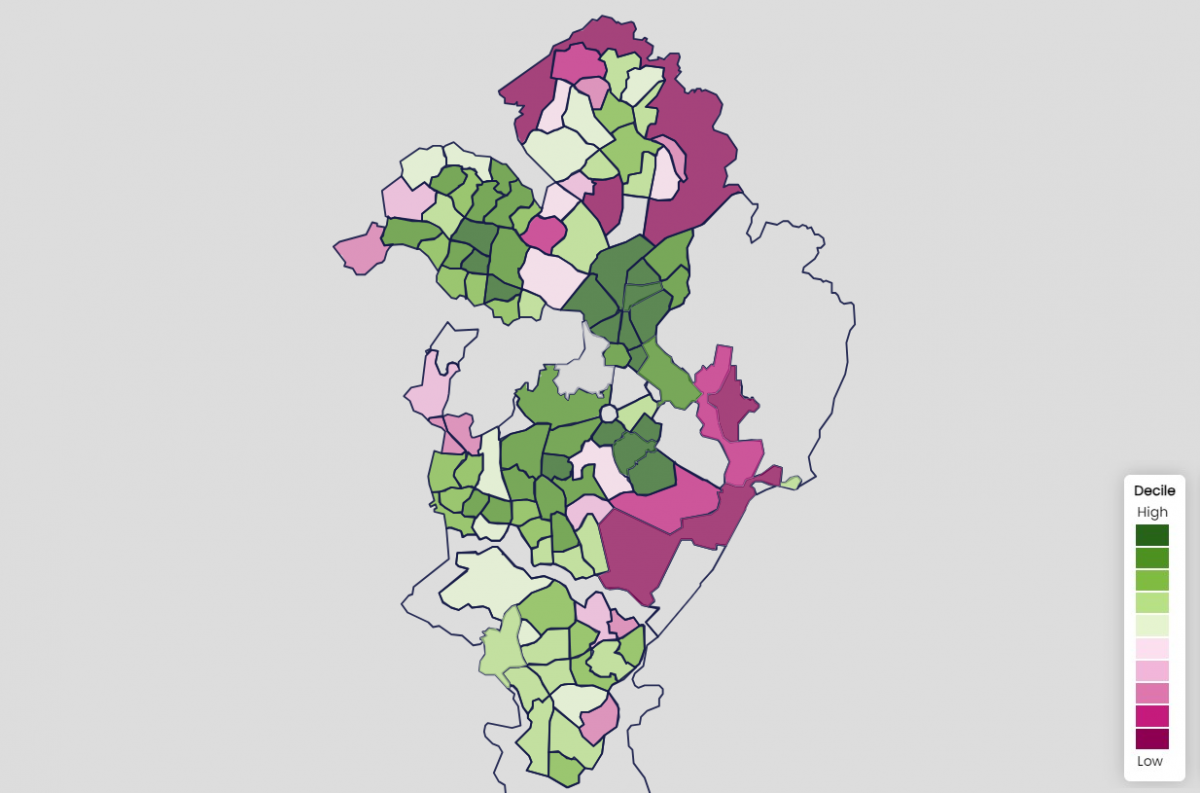
The AUO’s liveability index highlights differences in living standards across the ACT. Image: AUO.
“We know is there a divide that’s growing in Canberra in terms of the haves and have-nots,” Professor Davern said.
“The difficulty with planning is that we don’t go, ‘Maybe we should put more people in those well-serviced areas in the middle’. Because when we look at housing, we can see that people are coming in, particularly up in the [outer] north. They’re coming to that area, and they’re not going to have the same liveability as the people in those inner gentrified areas.”
Similarly, looking at local employment – the number of people living and working in the same area – Professor Davern noticed that “at the suburb level, in the middle of Canberra and all that gentrified area, it’s really high. So, people are living and working in that same area”.
“But when I click up in the northern area, it’s completely red; it’s not present in the suburb of Gungahlin, [for example].”
Professor Davern says data is only one side of the story and that the AUO hopes its maps will inspire conversations at the community level.
“Data is only one source of information,” she said.
“We want policymakers and planners to have these conversations with community … We want people, even the general community, to be able to go back and go to the council and say, ‘What are you doing about this?'”
Original Article published by Lizzie Waymouth on Riotact.