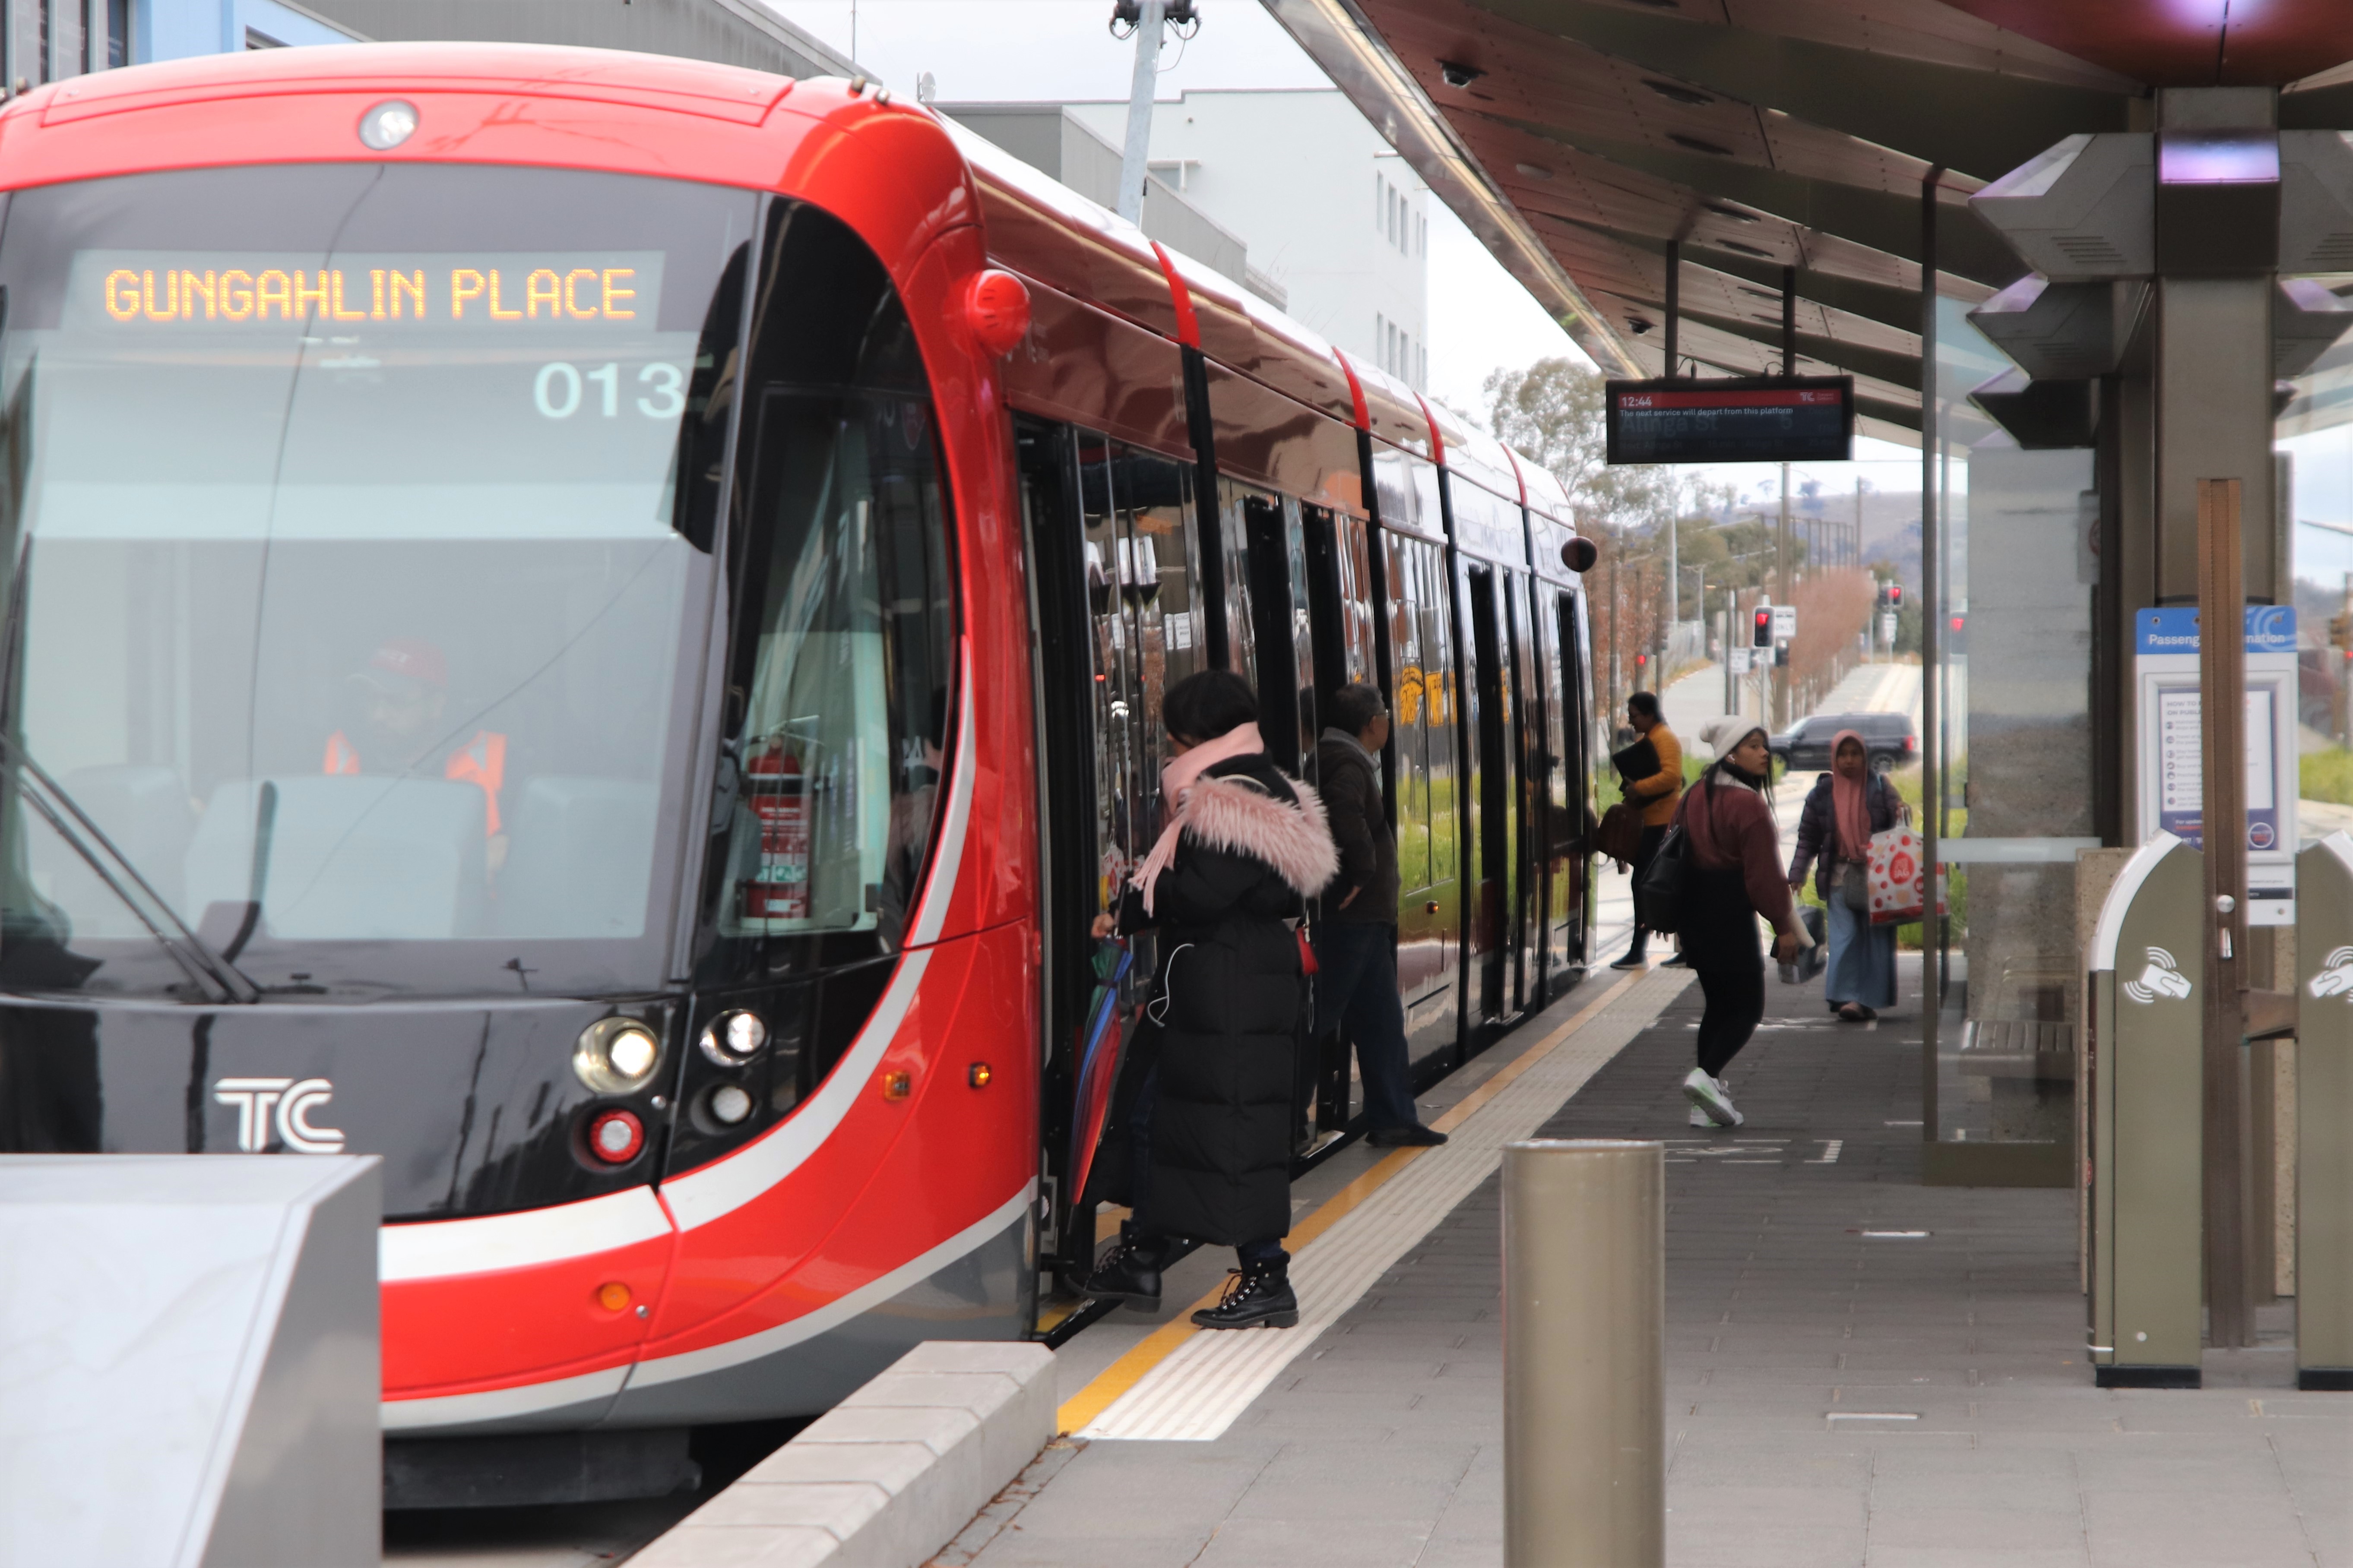
The Gungahlin region is driving the ACT’s population boom, taking out second position nationally as a fast-growing region and increasing its population by 50% in five years, according to the 2016 census data just released by the Australian Bureau of Statistics.
Since 2011, the region has experienced a massive population influx, increasing from 47,303 residents in 2011 to 71,142 in 2016. But that’s not the only factor rapidly changing within the region.
So how does Gungahlin shape up, what does it look like and who now resides in this thriving mini-metropolis?
Who we are
Gungahlin residents are young, relatively well off and family focussed according to the latest census, which indicates the median age for the suburb is 31, comprising 49.5% males and 50.5% females.
That’s changed little in the past five years, but is younger than the ACT’s median age of 35, and the national median of 38.
Meanwhile, almost a quarter of the region’s population is children aged up to 14, which is also higher than the ACT and national averages of 18.7%, and is a figure that’s altered little since 2011.
The majority of residents aged over 15 are married (55.2%), 34.3% have never been married, while 6.3% are divorced, 2.3% are separated and 1.9% are widowed. Almost 80% of households contain families, compared to the national average of 71.3%.
And it’s a region where most households (56.4%) comprise a couple that has on average 1.8 children residing with them. In comparison to 2011 there are now more couples with children in the area but they have fewer to care for. In 2011, 54.3% of households comprised couples with children, caring for an average of 1.9 dependents.
Meanwhile, the latest statistics show 30.8% of households are couples with no children, 11.6% are single parent families, and 1.3% are “other family”.
Where we come from
While the majority of Gungahlin residents (62.2%) were born in Australia, the region is embracing immigration. Since 2011 the number of people born overseas who reside in Gungahlin has risen by 5.4%.
In order, the most common countries immigrants were born in are: China (5%), India (5%), England (2.3%), Vietnam (1.4%) and South Korea (1.3%).
Interestingly, it’s a very different story when it comes to ancestry, with the majority (43.9%) of Gungahlin residents second generation Australians with both parents born overseas, while 39.8% indicated both their parents were born in Australia.
That’s a shift from 2011, when 47.1% indicated both parents were born in Australia and 40% of residents listed both parents born overseas.
In terms of language, 62.4% of Gungahlin residents speak only English at home, while 35.6% are households where another language is spoken.
How we fare financially
Although employment data is yet to be released, Gungahlin residents do better than average on the economic front. Thirty one per cent of households have an income of above $3000 per week compared to only 16.4% nationally.
The median weekly household income of $2247 is $800 above the national median and almost $200 above the rest of the ACT. That’s a small rise on 2011 when median Gungahlin household income was $2176.
The individual median income is $1052, much greater than the national median of $662.
Gungahlin residents also have more change in their pocket at the end of the month than they used to. Median mortgage repayments are $2167 per month, down from $2300 in 2011. However these repayments are far above the national median of $1755.
Meanwhile the median rent is $390 per week, down $10 a week on 2011, but slightly higher than the ACT median of $380 and much higher than the national figure of $335.
How we live
Gungahlin has experienced a massive building boom in the past five years with the number of private dwellings increasing by over 46%. In 2011 there were 17,148 private dwellings, rising to 25,121 in 2016.
And, chances are, if you live in Gungahlin, you reside in a separate house with at least four bedrooms or more that currently commands a mortgage.
The region features 15,288 houses, 6300 semi-detached properties and 2035 apartments. That means although large single dwellings remain the predominant feature, a greater percentage of the Gungahlin population lives in units than they did five years ago. In 2011 only 3.8% of the population resided in units but that figure rose to 8.6% in 2016.
In a statistic that’s over 10% higher than the territory and national averages, 49.9% of Gungahlin residents are paying a mortgage while only 16.1% own their property outright. Nationally 34.5% of Australians have a mortgage, while 31% own their property. But that’s headway on 2011 when 51.4% of Gungahlin residents paid a mortgage.
Closely reflecting the national and territory averages, 31.9% of residents rent their home.
The final word
The 2016 census paints Gungahlin as a well-off and growing region, with increasing multiculturalism and ongoing financial stability. It’s a place for families keen to get ahead in life where the great Australian dream of their own home and a backyard is the everyday and affordable reality.

