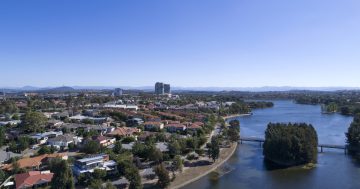
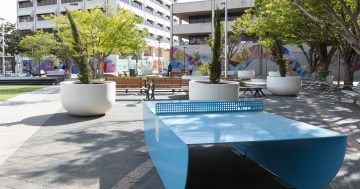
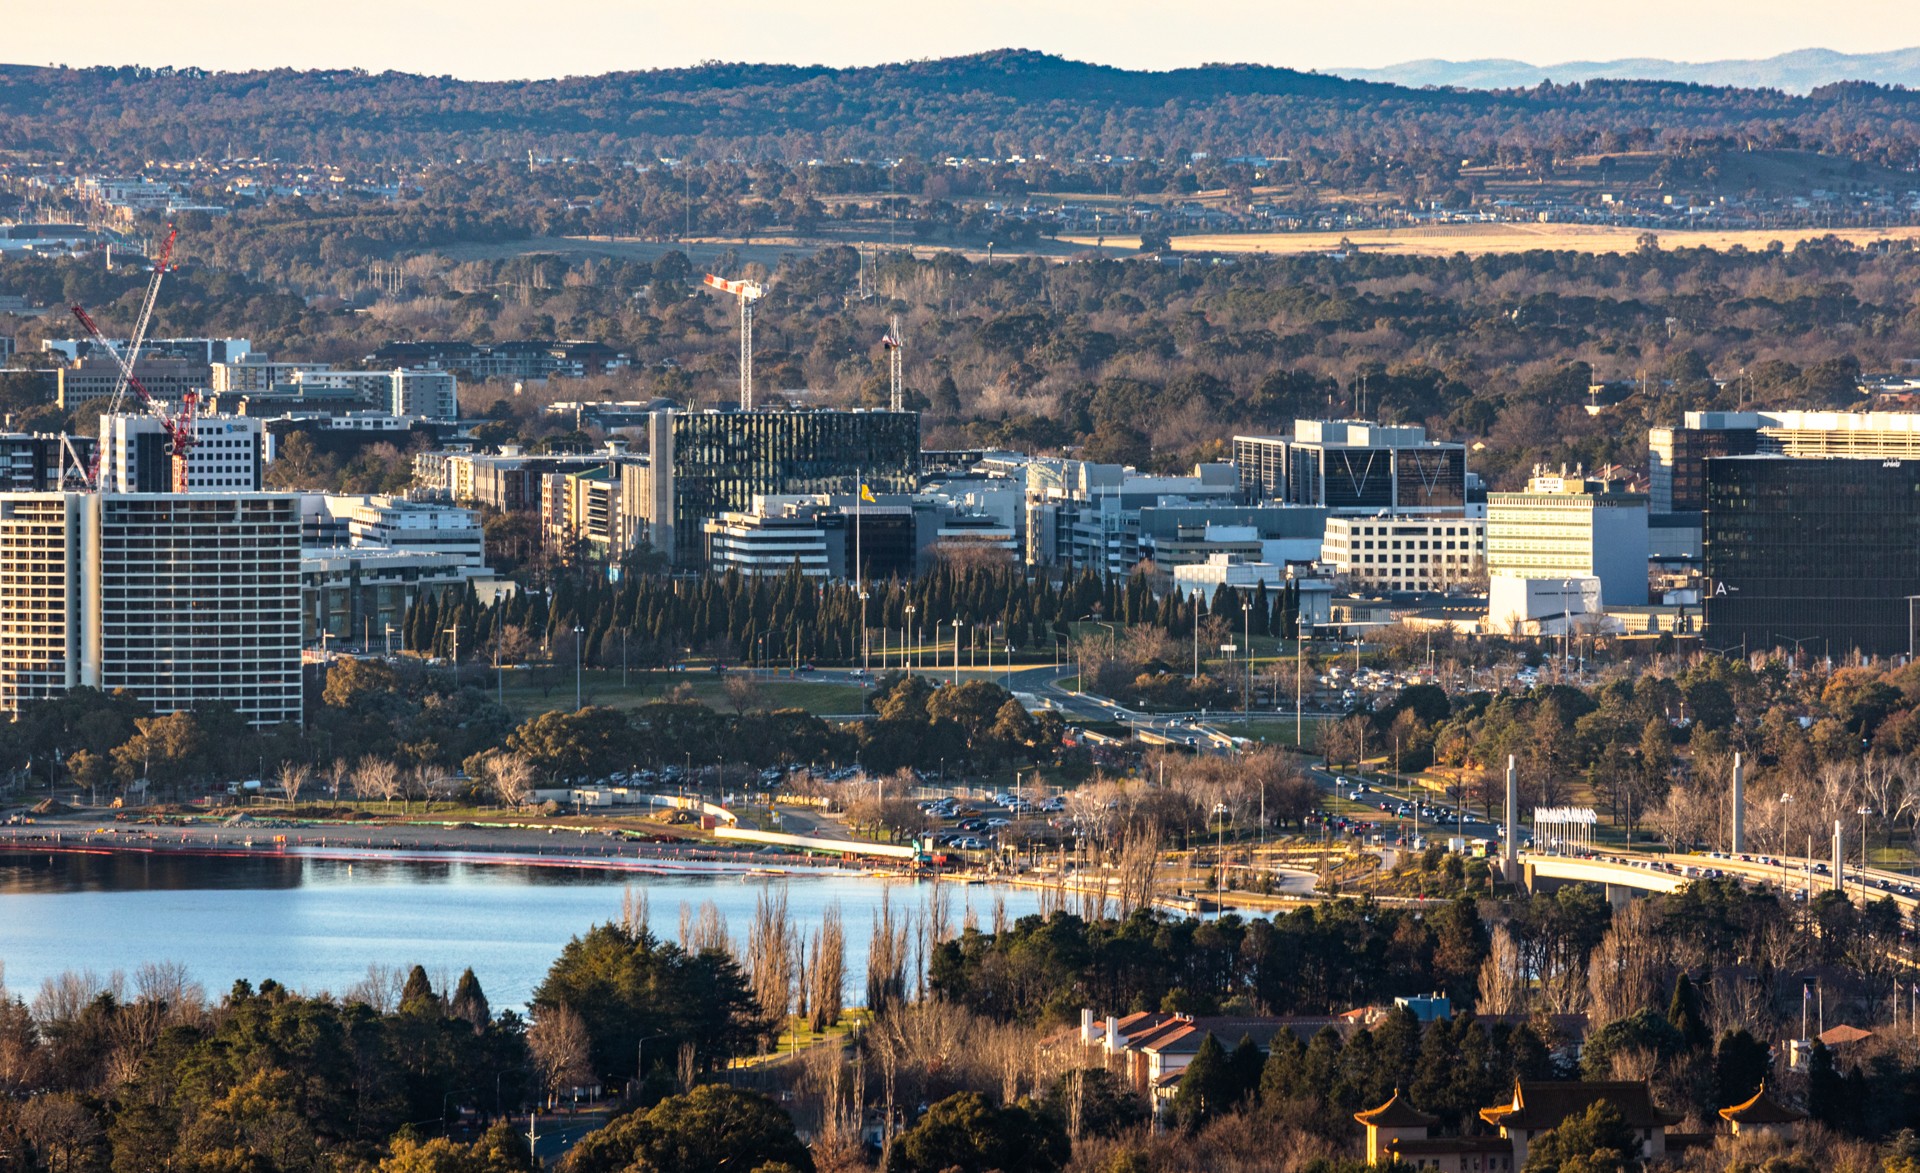
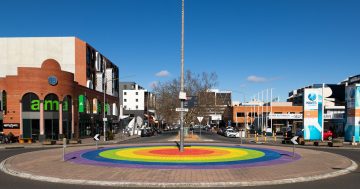
With a population increase of 500 people in the years between 2011 and 2016, the suburb of Gungahlin is indicative of the greater region’s growth.
It features a young, affluent community where the income is comfortable and lifestyle is important.
So, let’s investigate further how Gungahlin has changed over the past few years.
Who lives in Gungahlin
The most recent Census indicates Gungahlin has increased its population by 9.2% with 6134 people now calling the suburb home. Residents here are four years younger than the ACT median and seven years younger than the Australian norm, with a median age of just 31.
Children aged up to 15 make up 19.7% of the population, those aged over 65 comprise 4.7% and a whopping 32.8% of residents are aged between 20 and 34. It was a similar story in 2011 when 21.9% of residents were aged under 15, and 35.2% pf the population was aged between 20 and 34.
Of those 15 and older, 49.6% are married, 39.8% have never been married, 8.7% are divorced or separated, and 1.8% are widowed.
Most residents (71.1%) live in family households, 21% live alone, and 7.9% reside in share accommodation.
The majority of those family households (52.5%) are couples with children and they have on average 1.8 children under their roof. A further 34.6% are couples without children, and 11% of households are single parent homes.
How Gungahlin residents fare financially
Gungahlin continues to be a suburb where residents command a weekly income much greater than the national norm, however the ACT in general has caught up in recent years.
In 2011, Gungahlin residents earned a median household income of $2074 each week. At the time it was $840 above the national statistic, and $154 greater than the ACT median. A stunning 23.8% had a gross weekly income of $3000 or more, compared to a Territory statistic of 23.7% and an Australian figure of just 11.2%.
By 2016, Gungahlin’s median household income had decreased a little to $2066 each week. That figure remained well above the Australia-wide statistic of $1438, and marginally below the ACT median of $2070. Meanwhile the latest Census shows 27.3% of Gungahlin households earned a gross income of $3000 or more each week in 2016, compared to 28.4% in the ACT, and 16.4% across Australia.
The weekly wage may have stagnated but most Gungahlin residents had more change in their pocket in 2016 than they did five years prior. In 2011 the median monthly mortgage payment was smack on the ACT statistic of $2167, while weekly rents were $40 above the ACT figure at $420.
By 2016 both had decreased. Monthly mortgage outgoings were now $19 a month less than the Territory norm at $2039, while rents had also decreased to reflect the ACT statistic of $380 each week.
How Gungahlin residents live
Just as the financial situation has changed a little in recent years, so too has Gungahlin’s housing. In 2011 there were 2202 private dwellings, 42.1% of which were separate houses. A further 34% were semi-detached and 23.3% were flats or units.
By 2016, there were 2332 residences, with the small majority being separate houses (39.6%). A further 39.1% were semi-detached or townhouses, while 21.1% were classed as flats or units.
Despite an increase in semi-detached dwellings, Gungahlin housing remains large. Almost half (45.8%) of properties are four bedrooms or more, 23.3% are three-bedroom homes, 11.8% are two-bedroom, and 16.3% are one-bedroom abodes.
Meanwhile the majority of homes (54.2%) are rented, 31.2% are owned with a mortgage, and just 12.4% are owned outright. This is in stark contrast to the ACT and Australian norms. In the ACT, 31.8% of properties are rented, 38.4% are owned with a mortgage and 27% are owned outright, while in Australia, 30.9% are rented, 34.5% have a mortgage and 31% are owned outright.
This indicates an increase in the rental market since 2011 when 50.1% of Gungahlin properties were rented, 38.2% were owner occupied with a mortgage and just 10% were owned outright.
Where Gungahlin residents come from
Gungahlin features a melting pot of culture with just over half the population (53%) born in Australia. Other countries of birth include China (8.6%), India (6.0%), South Korea (3.9%), Vietnam (2.2%) and England (1.6%), and this multicultural influence has increased slightly since 2011.
Then, 58.9% of Gungahlin residents were born in Australia, with other countries of origin being China (6.8%), India (3.3%), South Korea (2.6%), Vietnam (2.3%), and England (2.2%).
That means for many, a second language is spoken at home. In 2016, 52.4% of residents spoke only English, while other languages spoken at home included Mandarin (8.9%), Korean (4.0%), Vietnamese (3.0%), Hindi (2.4%) and Cantonese (2.0%).
The final word
Compared to some suburbs in the greater region, Gungahlin may not have recorded astounding growth. Instead this is a steadily expanding suburb that has come into its own. The income is stable, as are the residents and it continues to attract a young population, enjoying a solid start in life.


